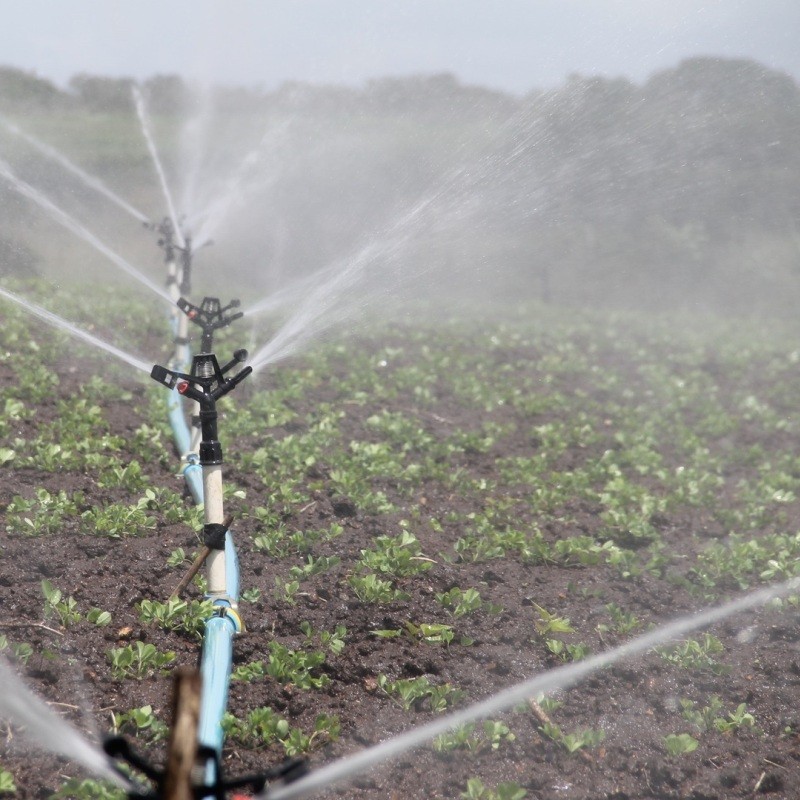
The mineral component of plant material is small and variable and depends on the plant part, age and conditions in which they were produced. For instance, the mineral component of citrus is at the highest 17% of the total mass of plant material.
Average mass of ash in citrus tissue
| Plant part | Ash content* (%) |
| Fruit
Leaves Shoots Wood Roots |
0.4 – 1.0
6 – 17 4 – 6 2 – 7 2 – 4 |
*The ash content is the residue after all moisture and organic material are burned away. It contains all the nutritional elements except carbon, hydroge
n, oxygen and nitrogen, and usually not sulphur and chloride.
Through the years, in the endeavors to increase plant production, a number of approaches have been tested to optimize inorganic nutrition.
- Right at the beginning the main objective was to determine, which elements were necessary for plant production.
- The next step was to identify deficiency symptoms.
- Next it was endeavoured to improve production by manipulating the inorganic nutrition. The first attempt was based on the amount of minerals that are removed by the crop from the orchard or field. The reasoning was that at least the same amount must be replaced.
The main result of the use of removal figures was that plant analysis became important. Leaf analysis has come to the front and has received the most attention.
- A logical result of leaf analysis was the developing of threshold values. According to this theory, production would increase if the mineral supply or the concentration of the nutritional elements increase till it reaches a level where after the increase in production ceases. Shortly thereafter leaf analysis was recognised as a diagnostic method.
- The next step was to concentrate on certain plant parts and physiological processes. Fruit, vegetative growth, fruit set, cell division and cell growth and their relationship with mineral nutrients were investigated. Well known applications of this work are the timing of nitrogen and foliar sprays with potassium nitrate, zinc and boron.
- Nowadays we strive to manipulate physiological processes in order to increase the utilization of mineral nutrients. One example is the re-mobilisation of precipitated calcium oxalate to increase the calcium of the apple fruit.
No matter which diagnostic method is used, plant analysis especially leaf analysis will form an integral part. Today it is necessary to evaluate the role of each nutrient element in production and to use the most effective method for optimal supply. The best sustainable income will be generated when nutrients are supplied in the most economic way, which ultimately is the goal of a good fertilisation program.
Leaf analyses are an indicator of the nutritional status of the trees. During the research into this method a relationship was established between the concentration of the nutrient elements in the leaves and production including all quality aspects. This relationship was developed for almost every nutrient element. For some like chloride and sodium only the maximum tolerable concentration was determined. Following the research, production-leaf-concentration-curves were established.
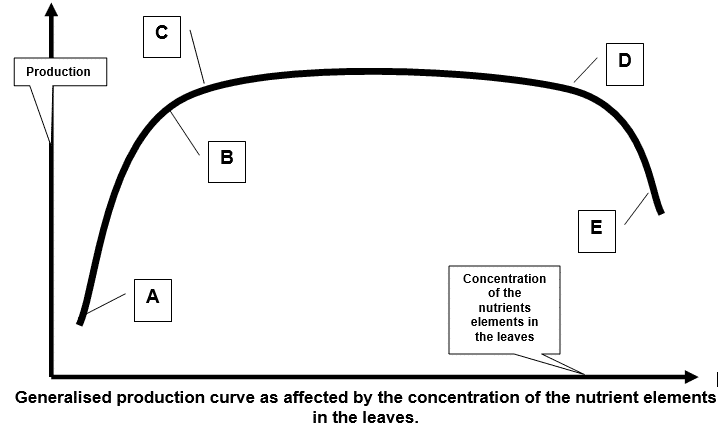
When the concentration of a nutrient increases from a very low status, the responds in production is dramatic as shown by portion AB. The part BC represents the best result in terms of production and nutrient status. CD represents the concentration range where a higher or lower concentration of the nutrient will have little effect on production. A decrease in production is experienced when the concentration of the nutrient is increased more than the maximum from D to E.
It is however impractical and hardly possible to keep the concentration of the nutrient within the narrow range of BC and in practise the concentration range between C and D is regarded as the optimal range. Any variation within this range will therefore be regarded as optimal and will not influence production.
These optimal ranges are not depended on external conditions like soil type, climate etc but these factors will differ between plant species and even selections within a specie.
Very important; when any of these production-leaf-concentration-curves are applied to determine the nutritional requirement, the leaf sampling procedure, especially the age and leaf type, should be the same as that when the curves were established. The same applies for the leaf analysis process. Different techniques can give different values for the same element on the same sample.
Therefore to apply leaf analysis as a diagnostic tool successful, one has to follow the same sampling (Leaf type, sampling time) and analytical procedures.
Have a look at some of our Learning-on-Demand Short Courses related to Agri Consult!
Beef Production

Writing an Agricultural Business Plan

Interpretation of Growth Medium Analyses Data